
Different countries have different distributions, click “change”. Canada, Australia, New Zealand have similar to the US. France, Germany, UK peak 40-44.
Different countries have different distributions, click “change”. Canada, Australia, New Zealand have similar to the US. France, Germany, UK peak 40-44.
That’s really interesting, thanks for the link.
Looking at the UK, there’s an interesting pattern between 2010 and 2019 - the 40-44 group is one of the lowest and is that the bottom of a dip. But by 2019, that same age group is the one with the highest rate, and is at the top of a hill.
I wonder why? What caused that age group and those around it to reverse their order?
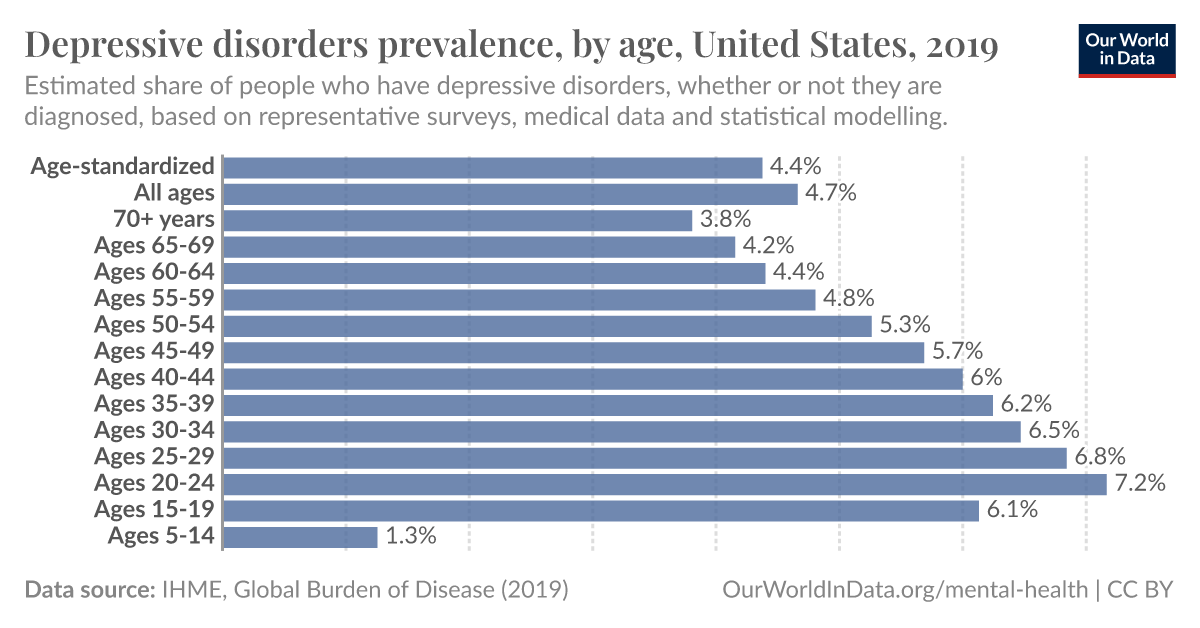
You can also see that shift here:
It’s different people in that group 9 years later? 40-44 in 2019 was 30-34 in 2010. In 2010 the 30-34 group was the second highest. Maybe they carry that spike with them over time.
Yeah, maybe.Although, that carry forward effect doesn’t seem to apply elsewhere, or else we’d see the same “hill-valley-hill” pattern shifted up a couple of age groups.
The numbers are probably too small for it to have any real significance, but it’s interesting anyway :-)